Third-year Queen’s students Jiahe Qiu (JQ; Mathematics and Statistics) and Daniel Bell (DB; Mathematics) are in discussion with Dr Jasmina Panovska-Griffiths (JPG; Lecturer in Probability and Statistics) about a themed special issue ‘Technical challenges of modelling real-life epidemics and examples of overcoming these‘ published recently in Philosophical Transactions of The Royal Society A.
(JQ to JPG) You were recently a lead editor on a special issue at the Phil Trans Roy Soc A alongside two of your colleagues. Tell us a little bit more about the special issue.
JPG: This invited theme issue is a collection of 16 invited papers that highlight the scientifically diverse contributions that the Royal Society RAMP initiative has made over the last two pandemic years. The papers within the special issue are from a diverse range of academics, most of whom contributed to the RAMP initiative, who have been modelling the transmission of COVID-19, borrowing methods from not only classic epidemiological modelling, but also from statistics, theoretical physics, molecular biology, and algebraic theory among others. The special issue gave a platform to showcase different approaches and discuss technical issues identified during the COVID-19 epidemic that are relevant when modelling future ones.
(DB to JPG) Is the RAMP initiative something new that emerged over the pandemic?
In February 2020, the UK already had a number of strong, established epidemiology groups and an independent national advisory body, SPI-M, which had a lot of expertise in modelling infectious disease spread. The RAMP initiative offered an additional set of diverse modelling expertise as a novel and experimental way of organising science during an emergency. The whole initiative was designed and led by scientists and operated on a volunteer basis and without a budget, supplementing the SPI-M work.
(JPG to JQ and DB) As students of mathematics, which aspects of the mathematical application in the special issue did you like most and least?
DB: I really enjoyed reading about the data analysis and inference methods that went into informing decisions. In particular, over the last two years, we have all heard so much about the effective reproduction number ‘R’ in the news, and I found it really interesting reading about how this is actually calculated in the paper by Ackland et al.
On the other hand, although the application of many of the papers is apparent, I would have liked it if there were more of an explanation of if, and how, the methods outlined were actually used during the pandemic. For example, keeping with the R theme, it would have been useful to know what the other models used to generate R were and how similar and different they are.
JPG: That is a very good point. In fact, Ackland et al is one of the models that has been used to generate R throughout the pandemic, as were a number of other models in the special issue, including my Covasim model for England. There is a complex mathematics (i.e. statistics) behind the combining of the R outcomes from a number of models described here, and we are currently working on a scientific paper that outlines how this method was applied by SPI-M and more recently by UKHSA to generate a combined weekly R value that is published on the UK Government Dashboard.
JQ: I was most fascinated by the article on Covasim agent-based model where you were a lead author. It gives a simple yet insightful example of how we can integrate geographical information into statistical models: by summarising common society interpersonal dynamics to school, work, household, community and assigning individuals by age group. I would say I enjoyed the articles – reasonable, refreshing, and very friendly to rookie statisticians like me. I also downloaded and played with PTRSA and Covasim repositories mentioned in the article. Is this work ongoing and what are the key questions you are looking at now?
JPG: I am glad you have enjoyed the paper on the application of the Covasim model and that you have tried running the simulations using the named GitHub repositories. This work is ongoing, and I continue to track the COVID-19 epidemic with this model. In addition, I am using the calibrated Covasim model, combined with statistical analysis of the genomic data, to explore the progressive transmissibility of the different Omicron variants over late 2021 and during 2022, and to evaluate the impact of the booster vaccinations in the autumn of 2022 and look at possible future epidemic trajectories.
(JQ to JPG). Maybe I omitted something, but there was one thing in this article led by you that I did not fully follow: how did the assumptions of transmission probabilities and the effectiveness of social-distancing rules come out? For example, “When schools reopened from 8 March 2021, we assumed a reduction in the per-contact transmission probabilities by 37% in schools” (from rsta.2021.0315 P8). Were these something biological and sociological, or were these also based on some statistical results?
JPG: Your question on how we fixed transmission probabilities across the different (household, school, workplace, and community) layers is a very good one. Deriving this number is tricky as it comprises a number of biological (e.g.. viral intrinsic transmissibility) and sociological (e.g. strength of contact mixing patterns in society) parameters that we don’t necessarily know. For the purposes of this study, the value we have used was derived as a combination of using data and statistical analysis. Specifically, we used the Google mobility data on the level of social mixing reported weekly, and a reduction in this that reflected the reduction in transmission from interventions such as mask-wearing or social distancing within schools (from existing literature) to generate a tight range of values for transmission probability within different layers of society. We then used this range to sample from during the calibration process and generate an average value that we used in the agent-based simulations.
(DB to JPG) The compositional modelling framework set out in the article by Libkind et al seems both intuitive and to have many advantages over traditional modelling. Is such a framework currently widely used, and if not can you see it gaining popularity? Does such a set up have any drawbacks that weren’t discussed in the paper?
JPG: The framework that Libkind et al use in their model is novel and hasn’t been used before for epidemiological modelling. I think it is very interesting that their framework suggests that you can draw a parallel between ordinary differential and delay differential equations with Petri nets with mass action kinetics as semantics for the same syntax formalised using concepts from category theory. Some aspects of this are also used in the compositional modelling in the paper by Waites et al. While there are not any obvious drawbacks to this method, further testing of the framework – against different diseases and incorporating different interventions, and datasets – may increase the confidence in this method as an additional tool to use in future as part of ongoing pandemic preparedness modelling.
(JPG to JQ) As you study mathematics and statistics Jiahe, were there any specific aspects of statistical application that you enjoyed reading about in the special issue? Did this motivate you to think differently about these concepts?
JQ: The paper by Swallow et al that tracked regional epidemics using weighted Principal Component Analysis (PCA) was very inspiring. PCA is an unsupervised machine learning method you have taught us in first year statistics, and I was aware of its application on time series data, especially in finance. However, this paper was the first time I saw how spatial and temporal information are used in PCA – not as columns in data, but as weighted matrices. And how this can be used to identify a proxy for epidemic status. It was interesting to see that the results suggested hospitalisations were the epidemic metrics across the nations – this is in line with the policy changes (e.g. starting or stopping lockdowns) that were influenced by a change (e.g. increase or decrease) of hospitalisations.
(JPG to DB) And you Dan have been studying mathematical biology last term, including simple SEIR models. Was there a specific aspect of mathematics applied to epidemiological modelling that you enjoyed within the special issue?
DB: Yes, simple SEIR models and the behaviour of their solutions is something I covered in my second year. What really surprised me while reading the special issue is how often such models occur in epidemiological modelling. One of the papers that really stood out for me was the one by Campillo-Funollet et al. When studying SEIR models in my degree, I often wondered how the initial data was gathered and how the parameters were estimated, and this paper did a great job of explaining how both are difficult with the model. The observational model set out in the paper, while being more difficult to study the solutions of, seems to be a good step forward in addressing some of the drawbacks of the SEIR model.
(JQ and DB to JPG) Did you learn something new in the process of editing the special issue?
Yes, of course I did. While all of the articles in the special issue had aspects that were interesting and expanded on the standard ways of doing modelling, two articles that stood out for me were those by Vernon et al and Dykes et al. While Vernon et al illustrated an alternative calibration technique for agent-based models that seems more efficient and faster, Dykes et al highlighted how important visualisation is throughout the analytical process and not just to illustrate the outcome of the analysis. Using history matching in an emulator seems to be a more efficient method for calibration of complex models – and this is important as even simple rejection Approximate Bayesian Computation methods can take days or weeks to calibrate a real-life network based ABM with the speed declining exponentially with increasing numbers of model parameters.
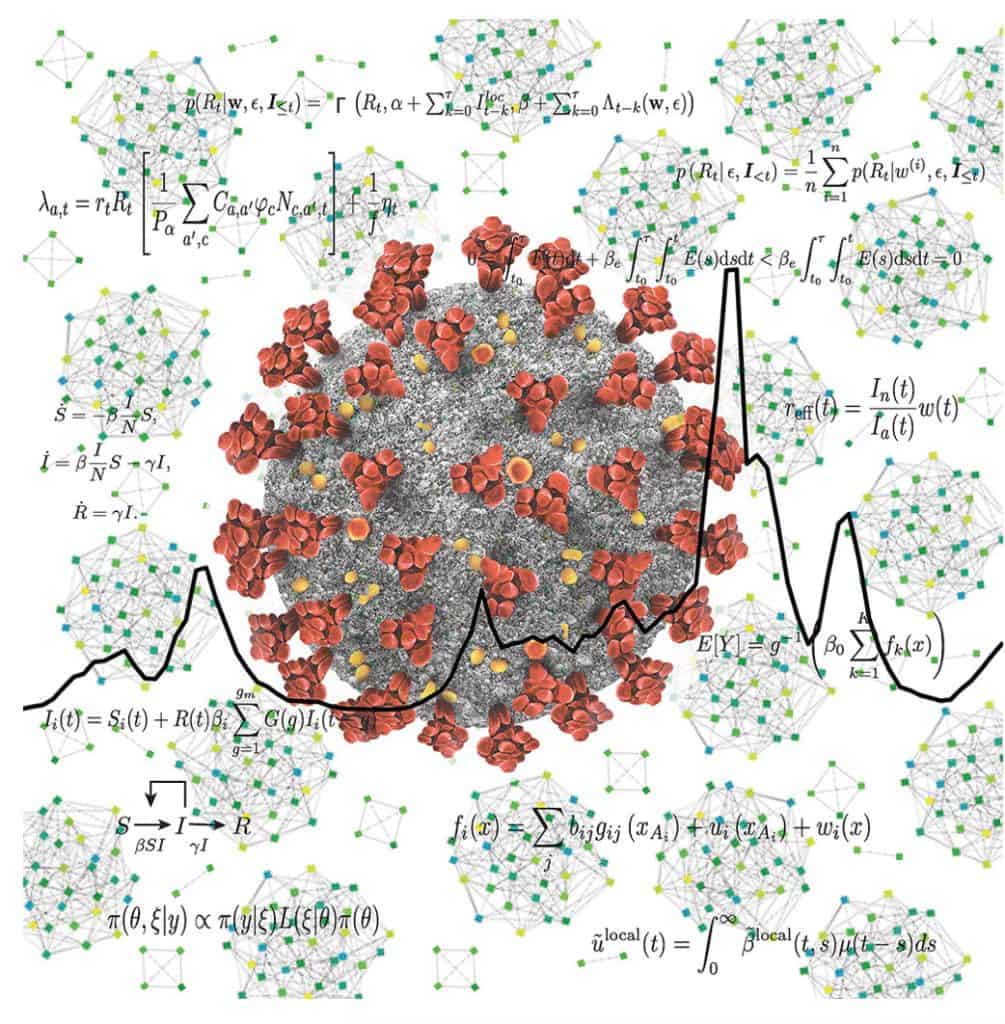
Intrigued by this method, I have recently started a follow-up work to check the feasibility, plausibility, and applicability of history matching calibration methodology on my Covasim model for COVID-19 in England, in collaboration with the lead author on the article. I also learned how Dykes et al have tapped their work on breaking the widely held preconception that visualisation is predominantly for communication of results post-analysis with an article that highlights the importance of incorporating visualisation early in the analytical process. While this is standard in 21st Century Visual Analytics, and met with some success in the visual epidemiological modelling efforts, the novelty of this work is in stressing that visualisation works at various stages and in various ways through the analytical process to support epidemiological modelling. I also learned how to edit a themed issue within a peer-reviewed journal and even put my artistic skills to use by designing the front cover image.
I very much enjoyed the whole process – from early conversations about an idea behind the issue to producing the final product. I hope the themed issue will be enjoyed by both the epidemiological modelling community and the wider mathematics community.